Examples
Examples of LST&E Validation efforts:
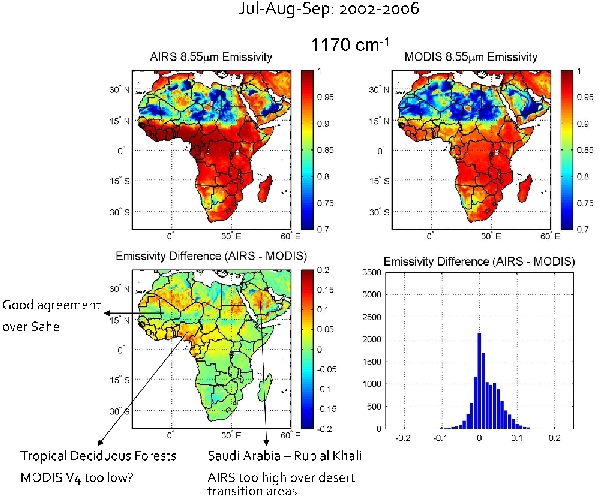
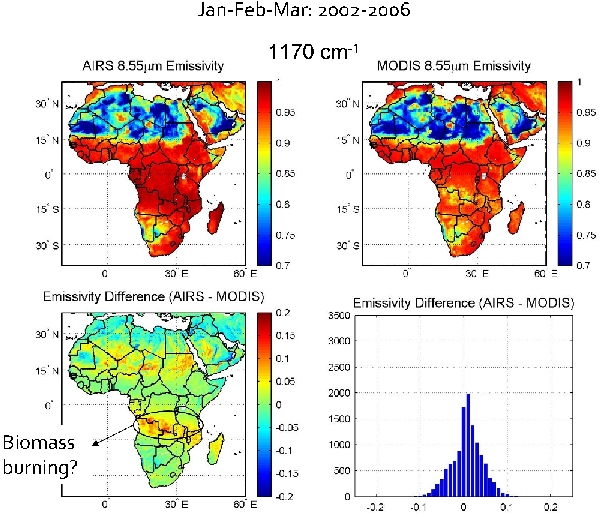
The following two figures provide examples of summertime and wintertime emissivity of Africa calculated from AIRS and MODIS. They illustrate the richness in data but also how the products differ.
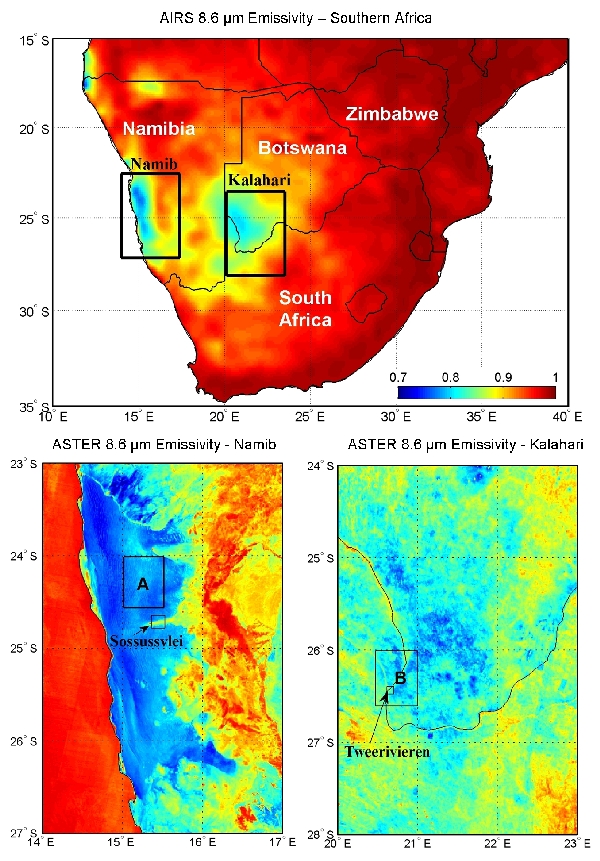
The next two slides illustrate how much higher resolution data from ASTER can be used to validate coarser resolution data from AIRS and MODIS and tie the validations to in situ
data.
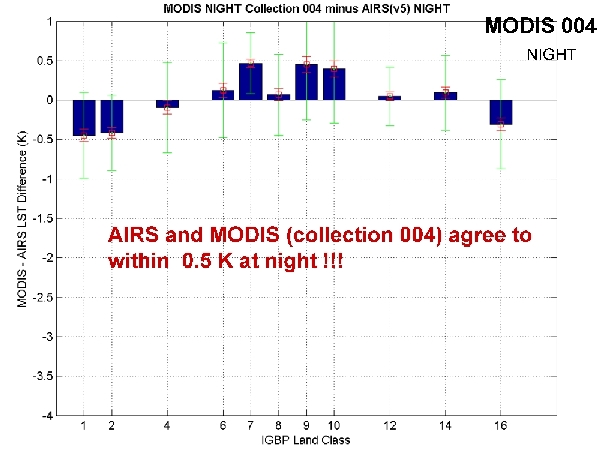
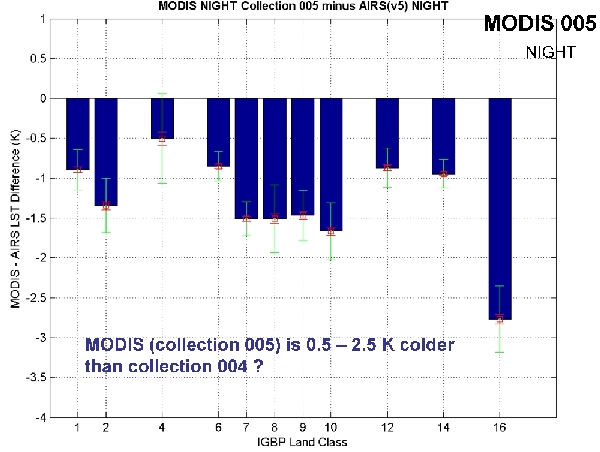
The next two figures show global nighttime LST differences between AIRS and MODIS v4 and v5 LST products grouped according to IGBP land cover class. These two figures courtesy of Bob Knuteson, UW-Madison.
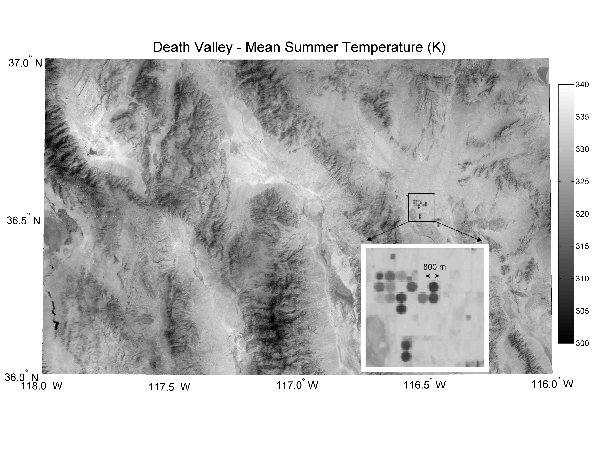
The next plot shows the mean summertime (Jul-Aug-Sep) ASTER LST extracted from the North American ASTER Land Surface Emissivity Database (NAALSED) over Death Valley. Notice that ASTER is able to resolve LST of objects at the crop-circle scale of less than 1 km (inset image).
